
Content of Blog:
- Sales Analysis on Google Map
- Process to Search New Customers Area Wise in Marg ERP Software
- Process of Date Wise Sales Option in Marg ERP Software
- Process of Company Sales in Marg ERP Software
- Process of Sale Increase/Decrease in Marg ERP Software
- Process of Active/Inactive Customers in Marg ERP Software
- Process of Outstandings in Marg ERP Software
- Process of Party GEO Location in Marg ERP Software
Overview of Sales Analysis on Google Map
Sales Analysis on Google Map of Marg ERP is a platform through which the distributors can increase their sales by 15-20% by viewing sales of retailers (customers) area wise, date wise and route wise on Google Map through Satellite view.

Along with this, Sales Analysis on Google map enables the distributor to search new customers.
With the help of this feature, the distributor can know which retailers are available in which particular areas.
With satellite view in Marg Software, the distributor can geo location wise view that in which areas sales are made and in which areas the sale is not made and can ask their salesman to reach those retailers.
This would also ensure the salesman to work efficiently as the distributor is keeping a track of the sales made by them through Sales Analysis on Google maps.
Suppose, when a distributor views the Sale Report of Delhi and is happy to see that sales are made in Laxminagar area of Delhi. But the distributor do not have any way to know that in which areas of Laxminagar sales are made. As it might be possible that sales are only made nearby Laxminagar Metro station. Generally, this happens because the salesman take the orders from the nearest or easiest shops only and they don’t try to reach the locations where it is not easy for them to go.If we talk about Laxminagar Area which is quite big and populated and there could be many other such areas where sales are not made.So, a distributor will never want that sale must be only made in limited areas. If a distributor get to know that salesman deals with only a few retailers, then they can ask them that why are they not contacting other retailers of different areas and if the salesman knows that the distributor is monitoring them location wise i.e. in which areas, they are active then they will try to contact more retailers that were previously ignored by them and thereby do more sales.
With Location wise Satellite view sale tracking facility the distributor can view that where people live and in which areas sales are made and in which areas sales can be increased in order to enable growth in the business.
Process to Search New Customers Area Wise in Marg ERP Software
Sales Analysis on Google Map can also be set user wise in Marg ERP Software i.e. set permissions for a particular user to view Sales Analysis on Google Map.
- In order to search new customers area wise, go to Daily Reports >> Business on Google Map >>Find New Customers.
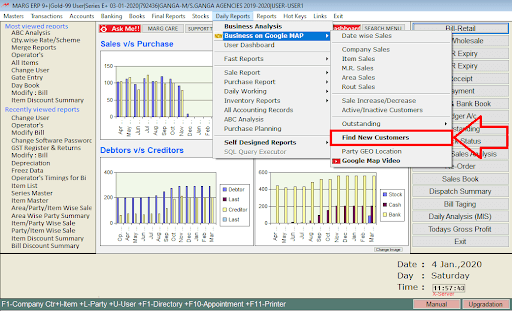

Fig. 1.1 Menu View to Find New Customers Option in Marg ERP Software
- A ‘Find New Customers’ window will appear where the user can set these fields according to the requirement to search new customers.
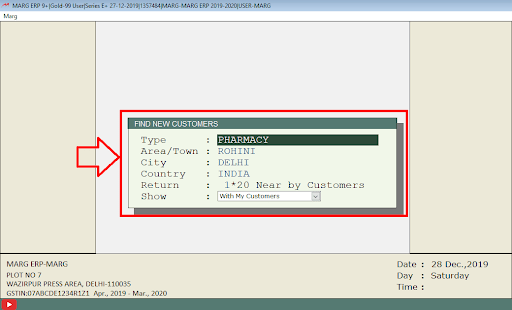
Fig. 1.2 View of Find New Customers Window in Marg ERP Software
-
- If the user wants to find new customers along with the existing customers, then select ‘With my Customers’ and if the user does not want to find new customers along with the existing customers then select ‘Without my Customers’.
- Press Enter.
-
- Then an alert message will be displayed to in which the user will click on ‘Yes’.
- So, in this way a map will be displayed in which the user can view the new customers list with satellite view.
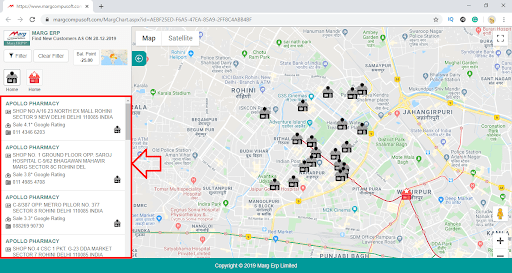
Fig. 1.3 View of New Customers List with Satellite View in Marg ERP Software
Process of Date Wise Sales Option in Marg ERP Software
- In order to view Date wise sales then go to Daily Reports >> Business on Google Map >>Date Wise Sales.
- A ‘Date Wise Sales’ window will appear in which the user will enter the date here i.e. from which date to which date the user wants to view the sales.
Suppose, mention 1st December 2019 to 19th December 2019.
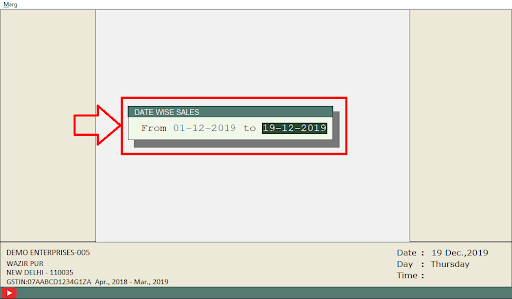
Fig. 1.4 View of Date Wise Sales Window in Marg ERP Software
- Now, the user can view those areas on the map in which the sales were made from 1st December to 19th December 2019.
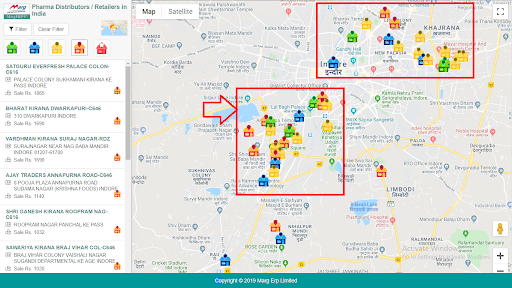
Fig. 1.5 View of Date Wise Sales on Google Map
-
- The user can click on ‘Satellite’ and see the satellite view of the areas in which sales is made and in which area sales is not made.
- The user can also see in the satellite view that in these areas people live but sale is not made here.
-
- So, in this way the user can view on the map and analyse that in which area sale is made and in which areas sale is not made.
- The user can increase the sales by viewing and analysing those areas in which sale has not been made.
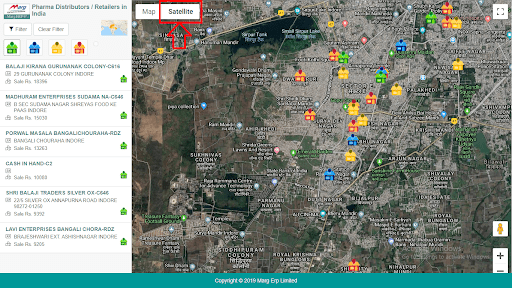
Fig. 1.6 View of Date Wise Sales through Satellite View
- Along with this the user can also view on the left side that the retailers are bifurcated to whom the sales have been made i.e. can view the name of the retailers, their address, sale, mobile number and email address.
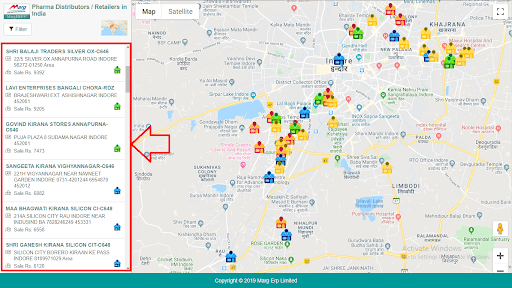
Fig. 1.7 View of Date Wise Sales on Business Map
- The user can also apply filter here as per their requirement.
Like, the user can view the home icons and, on that basis, can view the low to high sales. The green home icon indicates high sales and red home icon indicates low sale. And the icon of home in which there’s a star indicates distributor.
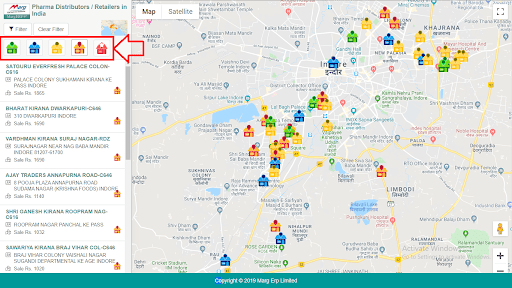
Fig. 1.8 View of Date Wise Sales on Business Map
- And along with this, if the user hover the mouse in this home icon then can view the details of that particular retailer here.
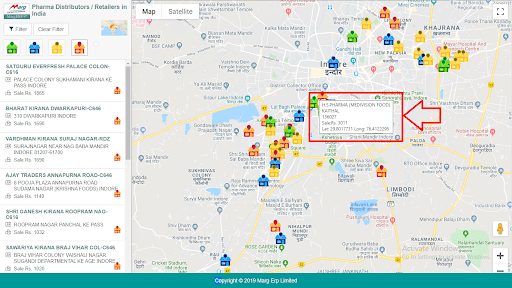
Fig. 1.9 View of Date Wise Sales on Business Map
- If the user wants, then can click on ‘Clear filter’ to remove the filter.
- After this, the user can also view Heat Map. The user will click on this and wherever the user can see green color on the map it means that in those locations retailers are there. And where the user can view more of red color along with green color that means that on those location there are more retailers. And in the heat map where the user doesn’t see green color that means there is no sale in that area.
- The user can also view the heat map in satellite view.
- And if the user wants to exit the heat map then click on ‘Heat map’.
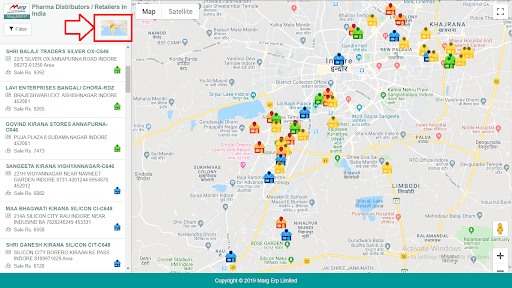
Fig. 1.10 View of Heat Map on Business Map
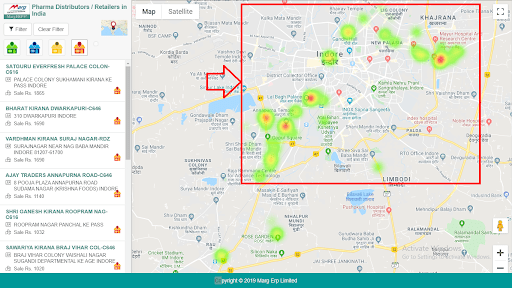
Fig. 1.11 View of Heat Map on Business Map
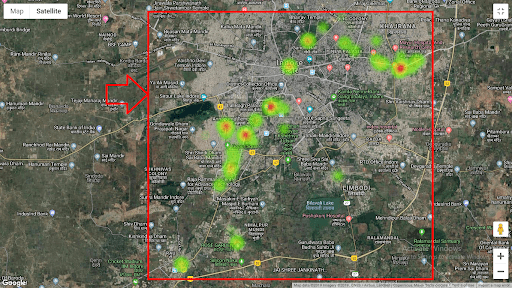
Fig. 1.12 View of Heat Map on Satellite View
Process of Company Sales in Marg ERP Software
-
- In order to view that which items of which company are sold in the area then go to Daily Reports>> Business on Google Map >> Company sales.
- A ‘Select Company’ window will appear in which the user will select the company of which the sales needs to viewed.
- If the user wants to select a particular company, then press ‘space bar’ key and select those companies. And if the user wants to select all company then press ‘Asterisk’ key.
-
- Press Enter.
- Select those items of which the user wants to view the sales and then press enter.
- Now enter the date i.e. from which date till which date the user wants to view company wise sales.
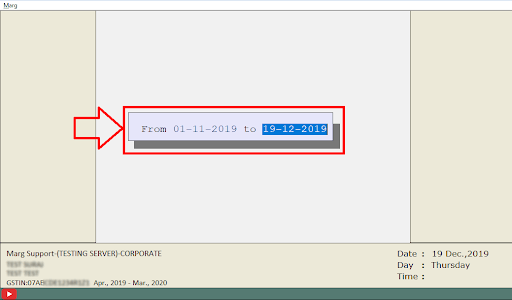
Fig. 1.13 Process to View Company Wise Sales in Marg ERP Software
- Now, the user can view Company wise sales on the map.
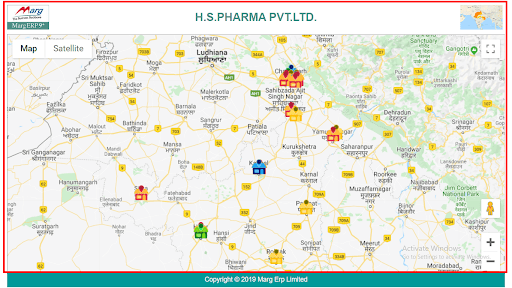
Fig. 1.14 View of Company Wise Sales in Marg ERP Software
In this way, the user can view Item Wise, M.R. Wise, Area Wise and Route Wise sales on Google Map.
Process of Sale Increase/Decrease in Marg ERP Software
- In order to view Increased and Decreased sale of the business then go to Daily Reports >>Business on Google Map >> Sale Increase/Decrease.
- A ‘Sale Increase/ Decrease’ window will appear in which the user will enter the date i.e. from which date till which date the sales needs to be viewed.
Suppose, the user wants to view the increased/ decreased sales from 4th December to 26th December 2019.
- Then an alert message will be displayed to in which the user will click on ‘Yes’.
- Now, the user can view on the map that from 4th December to 26th December 2019 in these areas sales have been increased or decreased.
- Like, here the user can view that sales have been increased by which amount.
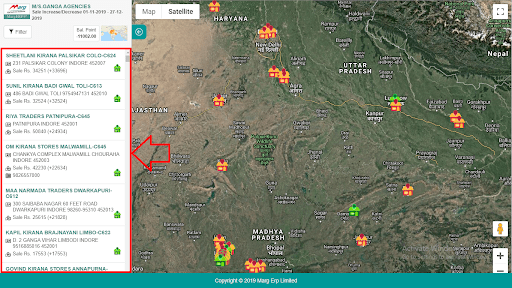
Fig. 1.15 View of Sales Increase/Decrease on Google Map
Process of Active/Inactive Customers in Marg ERP Software
- In order to view the active and inactive customers of an area, go to Daily Reports >> Business on Google Map >> Active/Inactive Customers.
- An ‘Active/Inactive Customers’ window will appear in which the user will enter the date here i.e. from which date till which date the user needs to view the active/inactive customers.
Suppose, mention 4th December to 27th December 2019.
- Then an alert message will be displayed in which the user will click on ‘Yes’.
- Now, the user can view on the map that from 4th December to 27th December 2019 which customers are active and which customers are inactive.
- Here, in green the user can view the active customers and in grey color the user can view the inactive customers with whom they are not dealing.
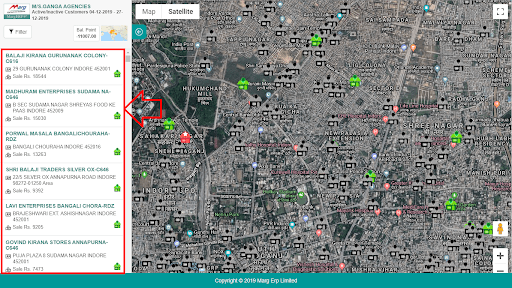
Fig. 1.16 View of Active/Inactive Customers on Google Map
Process of Outstandings in Marg ERP Software
-
- With the help of Sales Analysis on Google Map option, the user can view Oustandings in 4 ways i.e. Whole Outstandings, M.R. Outstandings, Area Outstandings and Route Outstandings.
- In order to view Total Oustandings then click on Daily Reports>> Business on Google Map >> Outstandings >>Whole Outstandings.
- The user can view that whole Outstandings will be displayed on the map.
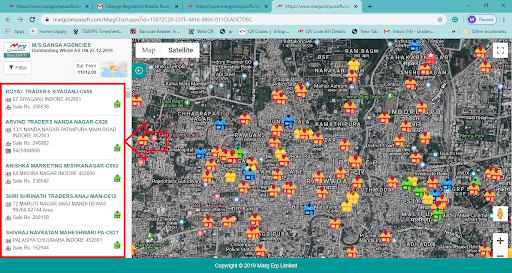
Fig. 1.17 View of Whole Outstandings on Google Map
- Similarly, in this way the user can view M.R wise Outstandings, Area Outstandings and Route Outstandings on the map.
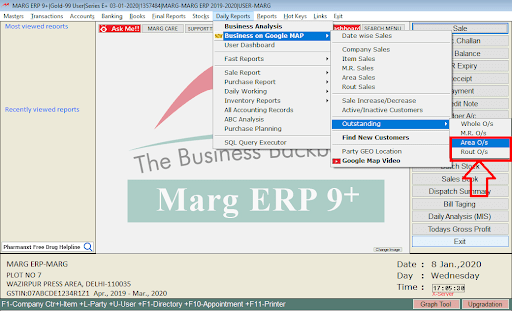
Fig. 1.18 Menu View to Area & Route Outstandings in Marg ERP Software
Process of Party GEO Location in Marg ERP Software
- Go to Daily Reports >> Business on Google Map >> Party GEO Location.
- Party GEO Location option enables the user to view parties and can see that how much kilometre distance is between the distributor and retailer. And along with this the user can view the latitude and longitude of the party.
The user can only view the latitude and longitude of those parties only on which parties details are already been mentioned and on the basis of these latitude and longitude the user will get the details of the retailer.
So, the user needs to mention the correct latitude and longitude in details of the parties.
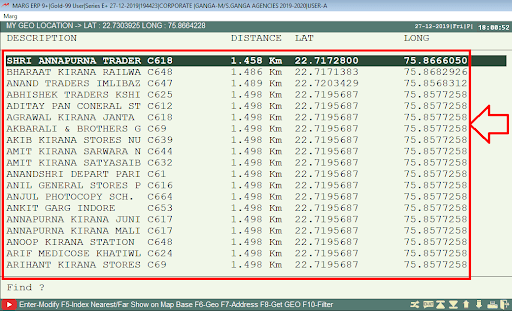
Fig. 1.19 View of Party GEO Location Window in Marg ERP Software
- Now, if the user will press F6 key on that party in which latitude and longitude is mentioned then on the basis of latitude and longitude the software will switch the user to the map.
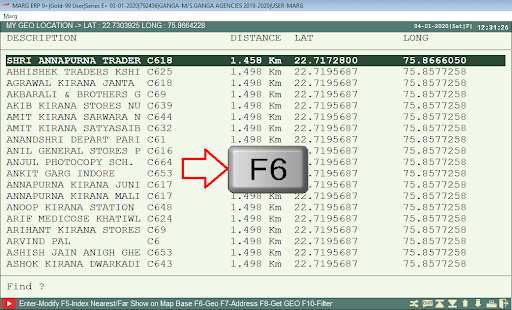
Fig. 1.20 View of Party GEO Location Window in Marg ERP Software
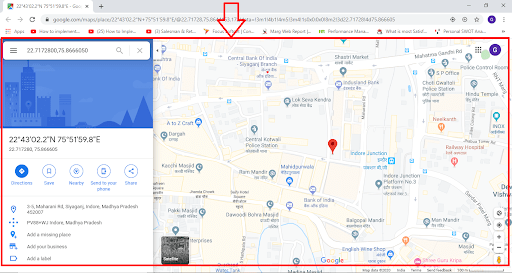
Fig. 1.21 View of Party GEO Location on Google Map
-
- And of those parties of whose latitude and longitude is not displayed and the user wants to know the latitude and longitude of those parties then press F8 key on that party.
- Now, the user can view the latitude and longitude of that party.
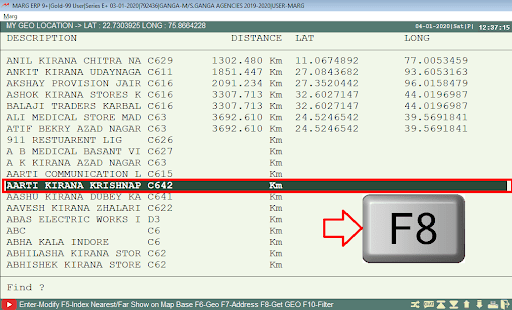
Fig. 1.22 View of Party GEO Location Window in Marg ERP Software
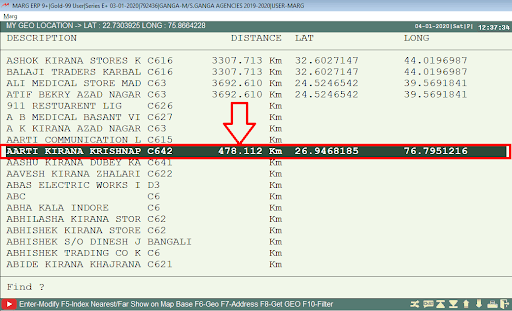
Fig. 1.23 View of Party GEO Location Window in Marg ERP Software
The distributor can set their latitude and longitude from the Control Room
Click here to watch Complete guide on “Sales Analysis on Google Map“ YouTube


